



Salary benchmarking in South Africa and the UK
How our salary benchmarks work
Job Crystal has been benchmarking salaries since 2009, and more than 6,000 clients have trusted us along the way. Our AI salary benchmark tool combines the salary data we have built up over that time with live market research, so you get a clear, evidence-based pay range for any role, on screen and in your inbox, the moment you submit it.
2009
Benchmarking since
6,000+
Clients have trusted us
Instant
On screen and by email
SA + UK
Rand and pound reports
Pay per job. No contract.
Benchmark one role or your whole structure
The short answer
Salary benchmarking compares what you pay, or plan to pay, for a role with real market data for similar roles, so you know your offer is competitive, fair and affordable. With Job Crystal you enter the job title, company, industry and location, paste in the job description, and our AI matches the role on responsibilities, seniority, skills and industry. It then checks the role against our own salary data, gathered since 2009 from candidate salaries, client job salaries, employment contracts, payroll and salary surveys, and against live market research. Your report shows the 25th, 50th and 75th percentiles, salary bands by experience, regional differences, gender pay gap analysis and practical recommendations, and South African reports add a B-BBEE and employment equity section.
Why it matters
You don't have to guess. You can know.
Most pay decisions are still made on gut feel, the last person's salary or what the candidate asked for. Guessing gets expensive quickly, in four ways.
Lost candidates
Offer too little and your best candidate accepts someone else's offer, often after weeks of interviews.
Overpaying
Offer too much and you carry the extra cost every month, and set a new bar for everyone else in the team.
Retention issues
People who find out they are paid below the market start looking, and good people find new jobs fast.
Internal pay disputes
Without data, every salary conversation becomes a negotiation, and inconsistent pay is hard to defend.
It's not about paying more. It's about paying right.
The process
Four steps. One clear answer.
Step 1
Tell us about the role
Choose the South African or UK tool, then enter the job title, your company, the industry and where the role is based.
Step 2
Paste the job description
Add the responsibilities, requirements and any other details. The more the description says about scope and seniority, the closer the match.
Step 3
We match and analyse
Our AI matches the role on what the job involves, not just the title, and compares it with our salary data and live market research.
Step 4
Get your report instantly
Your report appears on screen straight away, and a PDF copy is emailed to you to share with your team, finance or the board.
No exact match for an unusual job title? We use comparable roles and apply weighted adjustments for scope, seniority, skills and industry, and the report explains what was assumed.
Where the numbers come from
Built on 17 years of real salary data
Because we recruit as well as benchmark, we see real salaries every day: what candidates earn, what they ask for, and what employers actually agree to pay. Every report draws on six sources.
Candidate salary data
Current and expected salaries shared by candidates through our recruitment work.
Client job salary data
The salaries our clients budget and offer for real vacancies, not just advertised ranges.
Employment contracts
Agreed packages from employment contracts, showing what was actually signed.
Payroll data
Pay as it is really paid, including allowances and benefit contributions.
Salary surveys
Published salary surveys used to test and widen our own data.
Live market research
Current advertised salaries and published market sources, checked at the moment you run your report.
Salary data is used in aggregate to set market ranges. It is never used to identify an individual or another employer.
What you get
Inside a Crystal Clear compensation analysis
Every report follows the same structure, so you can compare roles side by side and share them with confidence.
- Executive summaryThe recommended range and the key points in plain language.
- Market salary benchmarksPay at the 25th, 50th (median) and 75th percentiles.
- Experience-based salary bandsMinimum, median and maximum for each experience level.
- Calculation methodologyHow the figures were built, what was matched and what was assumed.
- Regional salary variationsThe nine South African provinces, or UK regions for UK roles.
- B-BBEE and employment equity SA onlyRepresentation and pay context for South African employers.
- Gender pay gap analysisPay by gender for each role level, where reliable data exists.
- Strategic recommendationsNumbered next steps for setting the offer or reviewing pay.

Report header: role, industry, location and date
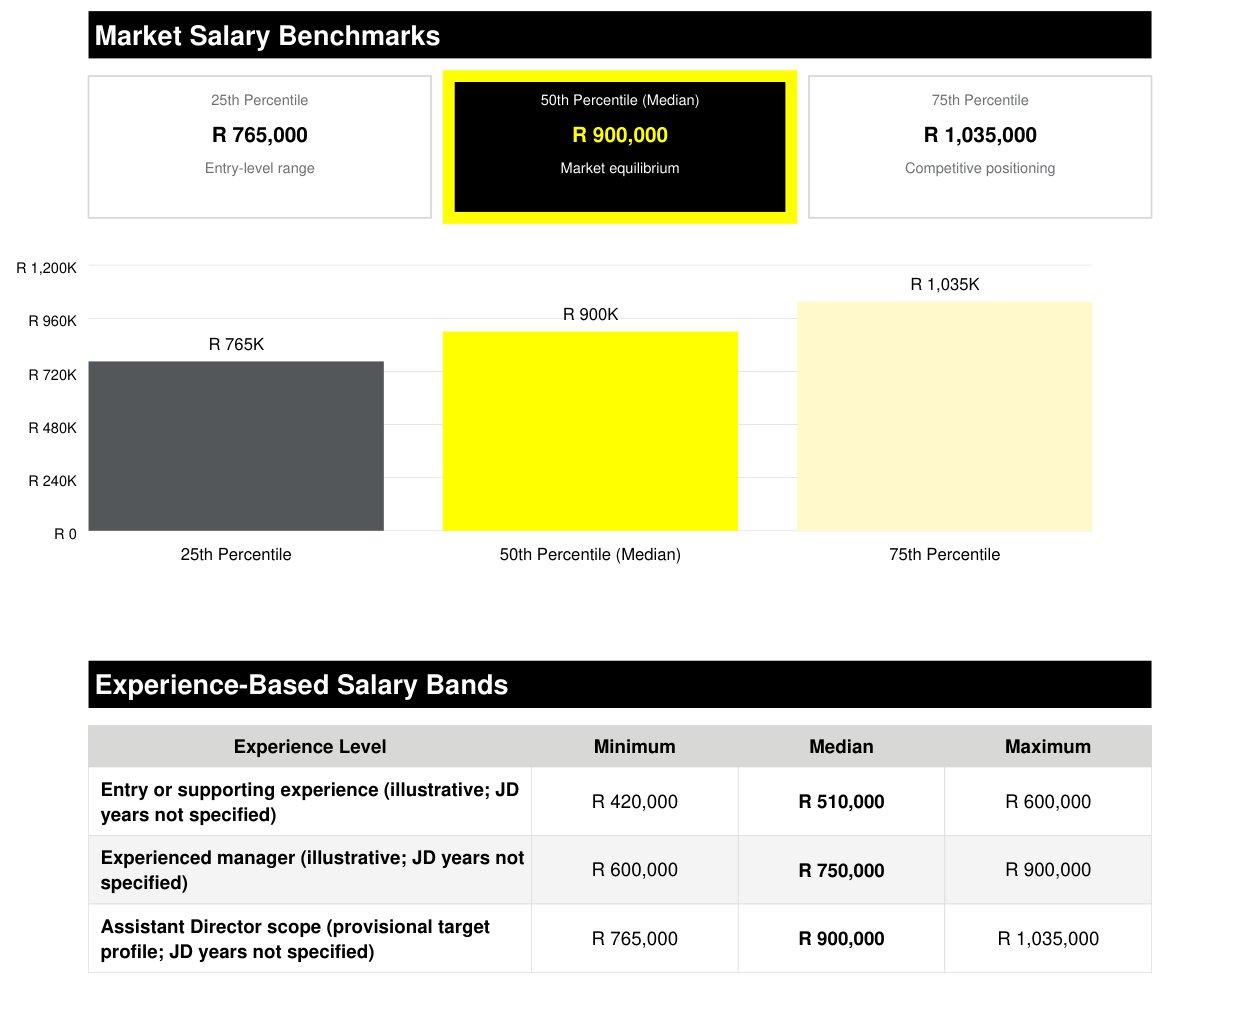
Percentiles and experience bands
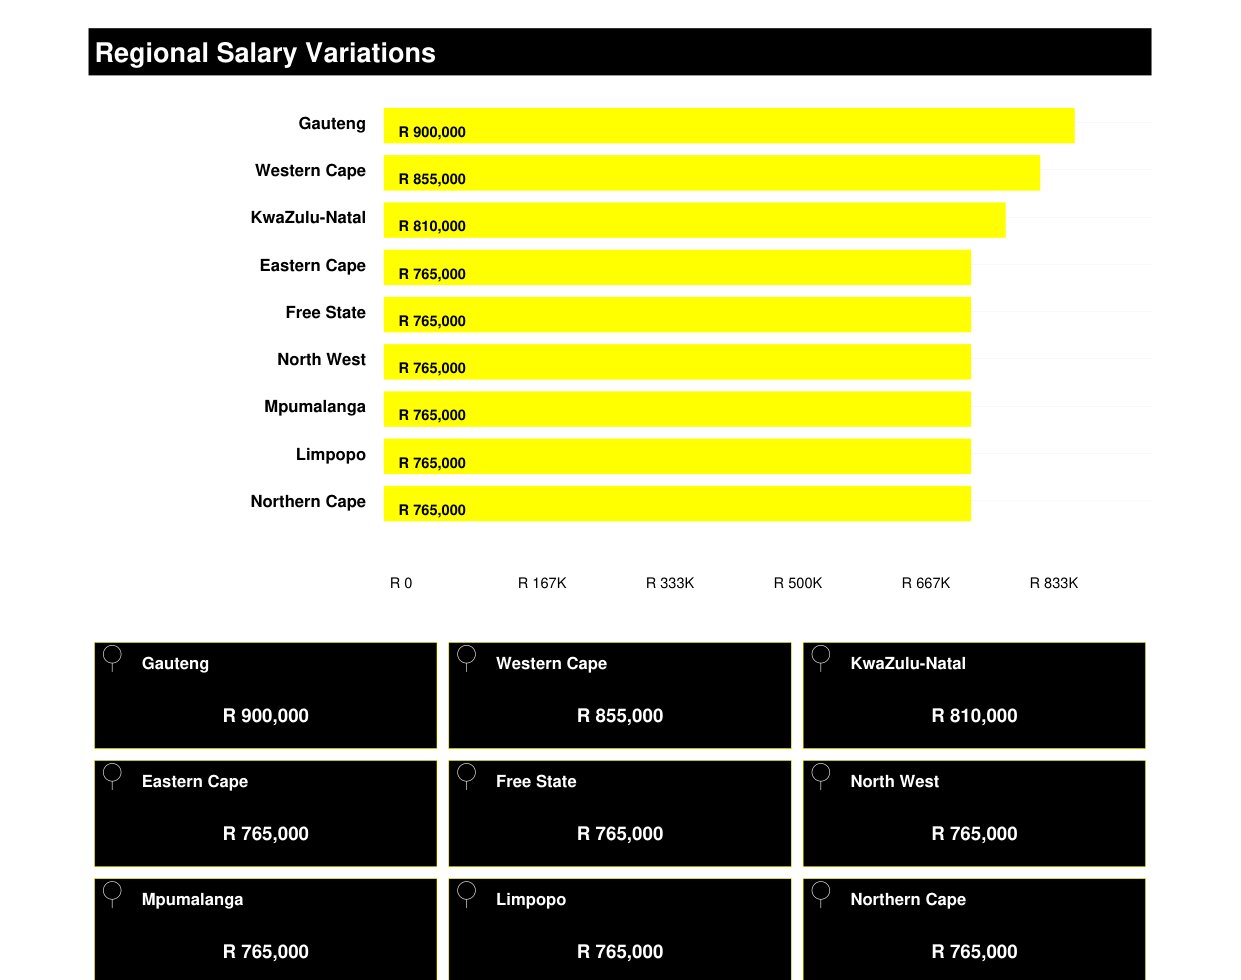
Regional variations
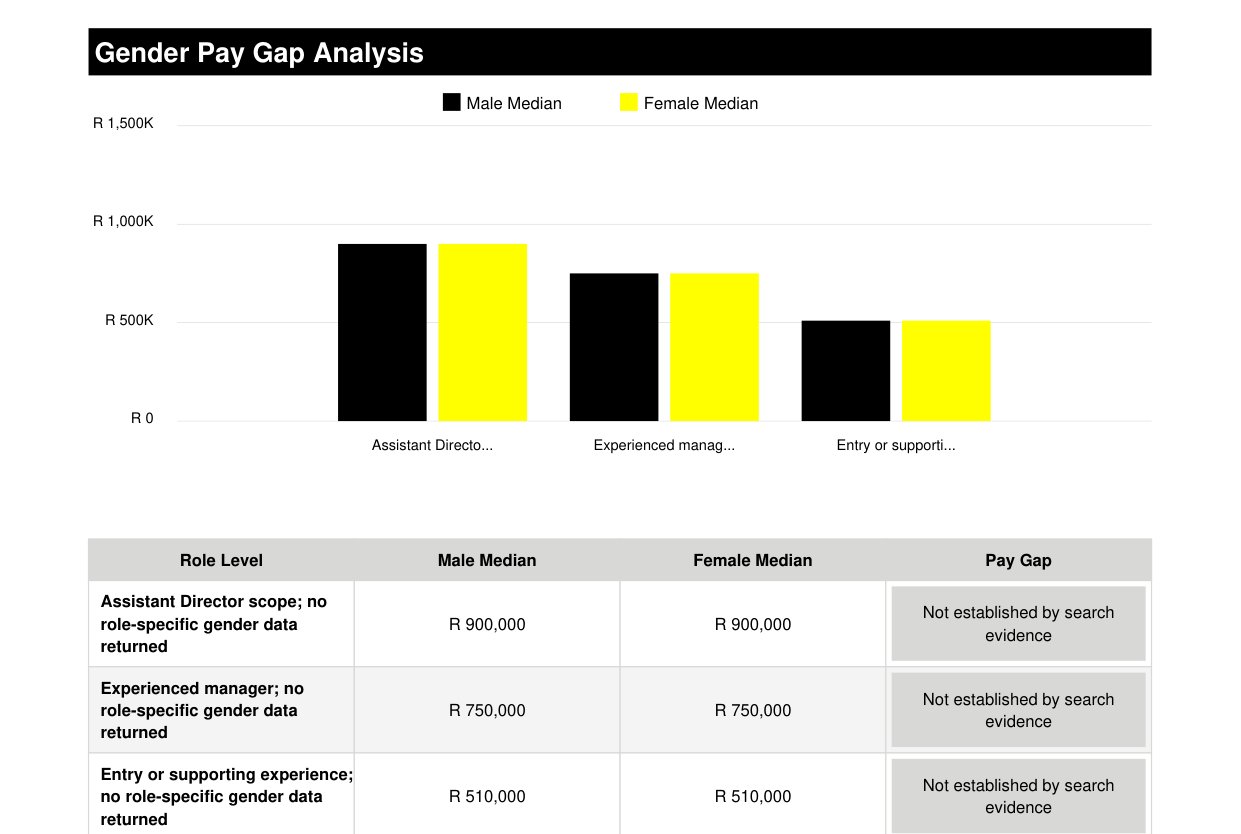
Gender pay gap analysis
Sample pages from a real report. Client details have been removed.
Two markets, one standard
South Africa and the UK
Pay works differently in each market, so each tool is built for the market the role is in.
South Africa
United Kingdom
Currency
Rand (R)
Pound sterling (£)
Regional view
All nine provinces, with Gauteng, Western Cape and KwaZulu-Natal usually the main reference points
UK regions, including London and the South East compared with the rest of the UK
Equity sections
Gender pay gap, plus B-BBEE and employment equity
Gender pay gap (no B-BBEE section)
Package focus
Total cost to company, with retirement and medical aid contributions carrying strong weight
Basic salary plus bonus, employer pension contributions and benefits
South African considerations
Pay differs between Johannesburg, Cape Town, Durban and other centres, and benefits such as retirement funding and medical aid carry a lot of weight in how candidates compare offers.
B-BBEE and employment equity priorities can increase demand for some candidates, and skills shortages can push premiums up by 20% to 40% for hard-to-find skills.
UK considerations
London and the South East usually pay more than other regions, so where the role is based matters as much as the job title.
Employers with 250 or more employees must publish gender pay gap figures every year, so consistent, defensible pay bands matter. Our UK reports include a gender pay gap section to support that work.
Turning data into a pay range
How we structure salary ranges
A benchmark is most useful when it becomes a range you can use for every hire and every review.
- The market median anchors the range.
- The minimum is usually 80% to 85% of the median.
- The maximum is usually 115% to 120% of the median.
- That gives a typical range spread of 30% to 50%.
Typical annual increases
Market movement
5–8%
Performance
3–5%
Promotion
8–15%
South African guide. Your report shows current movement for the specific role and market.
What counts as total compensation?
Not just basic salary. We give benefits a value so packages can be compared fairly: bonuses and commission, retirement and medical aid or pension contributions, allowances, insurance and other benefits, and equity where it applies.
When to benchmark
How often should you benchmark?
Annually
As standard, ahead of your pay review and budget cycle.
Quarterly
For competitive, hard-to-fill or high-risk roles where the market moves fast.
Immediately
During rapid growth, a restructure, or a sudden shift in the economy.
Common scenarios
What to do when pay gets difficult
A candidate wants more than the market rate
Validate the data, decide whether the premium is justified, look at the total package and check internal equity before you agree.
An employee says they are underpaid
Review the role objectively, share the data, and talk about where they sit in the range and how they can progress.
We can't afford market rates
Prioritise the key roles, strengthen the non-cash value of the package and agree a phased plan to close the gap.
What we do
- Benchmarking data and insightMarket ranges, percentiles and bands for your role.
- Recruitment and market intelligence17 years of hiring experience behind every report.
- Decision supportClear recommendations you can take to finance, HR or the board.
What we don't do
- Legal adviceOur reports are decision-support tools, not legally binding directives.
- Contracts or representationWe don't draft contracts or represent you at the CCMA, Labour Court or an Employment Tribunal.
- Guarantee complianceEmployers remain responsible for their legal compliance and employment decisions.
Trusted since 2009
6,000+ clients. Thousands of benchmarks.
From start-ups to listed groups, employers have used Job Crystal to set pay with confidence for 17 years.

























Questions
Salary benchmarking FAQs
Salary benchmarking compares the pay for a role in your business with real market data for the same kind of role, so you can check that your offer is competitive, fair and in line with your hiring plans. It replaces opinion with evidence, so you can stop guessing and know what a role is worth.
Ready for salary clarity?
Run a benchmark now and get your report instantly, on screen and by email. Questions first? Email info@jobcrystal.com, or in South Africa call 087 135 1005.